Static Components for Metrics
Metrics components are designed to display quantitative information clearly and efficiently. These components highlight key data points, trends, or comparisons, making it easy for readers to quickly understand and interpret numerical findings. Use metrics components when you want to emphasize results, performance indicators, or other data-driven insights.
Stat Cards
Stat cards display key metrics with four layers of information: a primary value, a label, supporting subtext, and a longer description, often paired with an icon. Below is an example of using a single stat card that spans the page.
Value
Label
Subtext
Longer description.
Stat cards are also effective for presenting multiple key data points together (2-4 per row). To show stat cards side-by-side, pair the .stat-card component with the .stat-cards-grid, .multi-column-section or .columns structure/layout templates.
40
Omni Experts
Research, Evaluation, and OrgDev
Longer blurb about Omni staff.
10
States
Remote Work Climate
Longer blurb about Omni staff spread across US.
9
Project States
Current Projects
Blurb about Omni’s N of states for active projects.
6
focus areas
Our areas of expertise
Behavioral health, justice, etc.
Alert Box
Compact alert boxes are for warnings or callouts that need to accompany a stat.
ALERT TITLE
25%
of users affected
Description text.
≈5,000 people impacted
If your report uses 1 alert box, consider adding narrative or data viz next to the alert box using the .columns formatting.
Lorem Ipsum is simply dummy text of the printing and typesetting industry. Lorem Ipsum has been the industry’s standard dummy text ever since the 1500s, when an unknown printer took a galley of type and scrambled it to make a type specimen book. It has survived not only five centuries, but also the leap into electronic typesetting, remaining essentially unchanged. It was popularised in the 1960s with the release of Letraset sheets containing Lorem Ipsum passages, and more recently with desktop publishing software like Aldus PageMaker including versions of Lorem Ipsum
ALERT TITLE
25%
of users affected
Description text.
≈5,000 people impacted
Accent Boxes
Accent boxes are used to feature key statistics and are visually similar to Alert Boxes. The main difference is the colors bar on the left side of the box in the Alert Boxes.
Label Text
Supporting subtext
$2.5B
Additional context
Stat Highlight Box
Use stat highlight boxes to emphasize key stats with large numbers. The accented color option is plum, or you can add a white background to the box.
38%
of Omni employees live in Denver, Colorado.
These boxes can be paired with multiple boxes side-by-side. See a few examples below.
42%
of respondents agreed
38%
of Omni employees live in Denver, Colorado.
And another example showing the two stats together with a note below to provide additional context.
42%
of respondents agreed
38%
of Omni employees live in Denver, Colorado.
Additional context below stats.
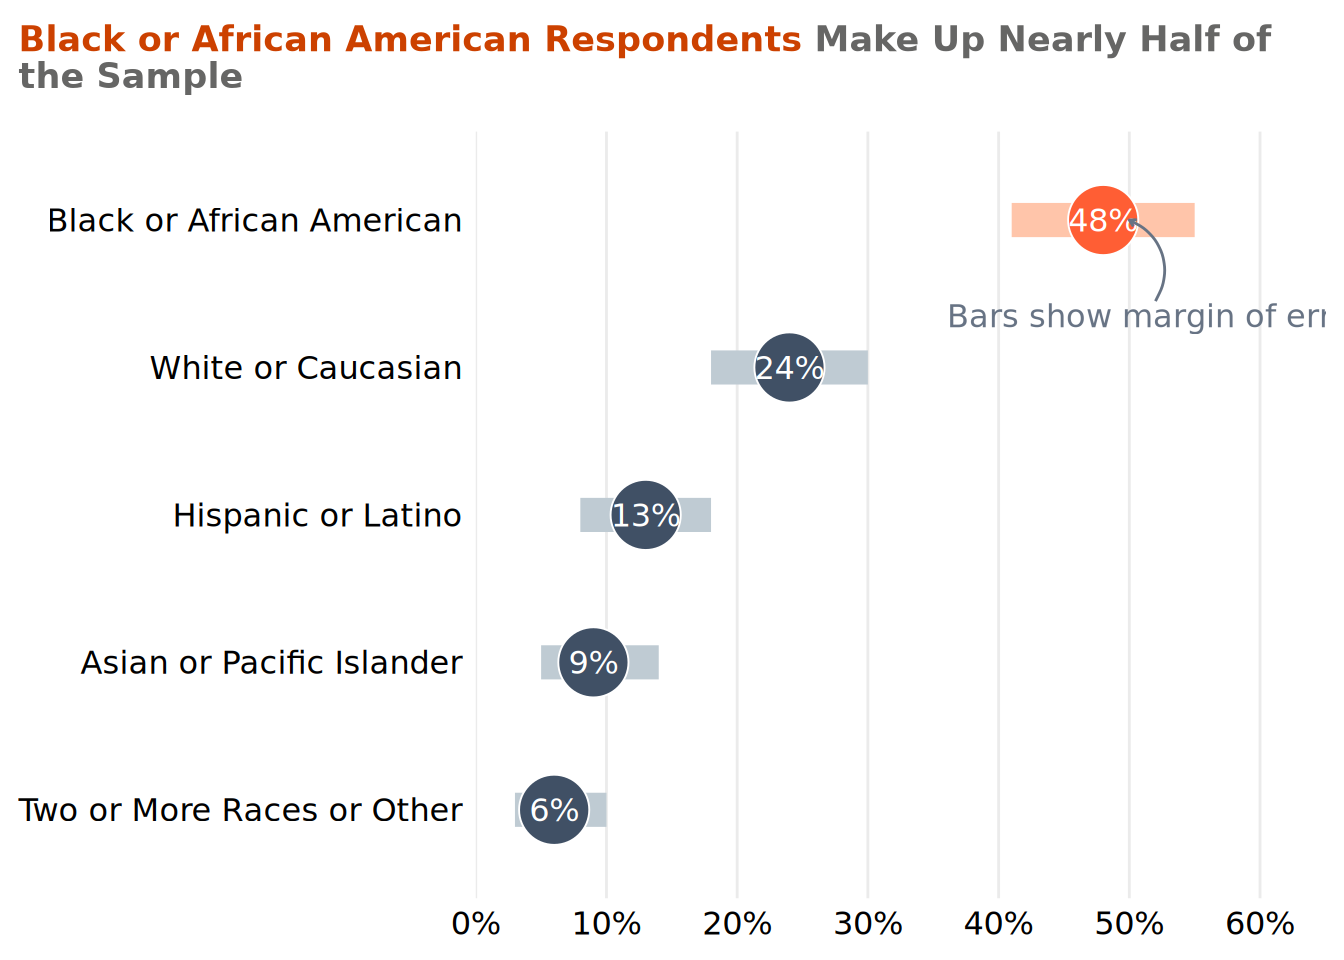
Chart Containers
Chart containers are used to frame and support data visualizations.
Includes all respondents to the 2024 Equity & Inclusion Survey (n = 204)